Custom Autoscaling for GitLab Kubernetes Executors
An overview of why and how our team at Quantum Metric implemented custom autoscaling for GitLab CI jobs running on Kubernetes.
- tags
- #Kubernetes #Gitlab #Ci-Cd #Autoscaling #Devops
- published
- reading time
- 8 minutes
I recently had the opportunity to share some really interesting work that our team at Quantum Metric was doing to improve the performance and reliability of our GitLab CI pipelines.
The intention of this article is to provide an overview of why and how our team decided to implement our own custom autoscaling for our GitLab CI jobs running on Kubernetes.
Introduction
Our engineering organization has evolved significantly over the past three years. We have experienced rapid growth within our teams as well as our customer base and we continue to improve how we are delivering value quickly and reliably to our customers.
Naturally, this has led to increased volume of CI pipelines we are running, forcing us to continue evolving and improving the infrastructure supporting it.
While we were originally able to support this using a few on-premise Docker Executors, we eventually outgrew this and migrated to Kubernetes Executors in hopes of leveraging the Cluster Autoscaler to manage capacity and better handle the frequent increases and decreases in CI jobs.
Overall, this was successful and resulted in our team configuring four executors segmented by resource requirements which allow a CI job to more accurately declare the resources it expects to use and target a corresponding executor.
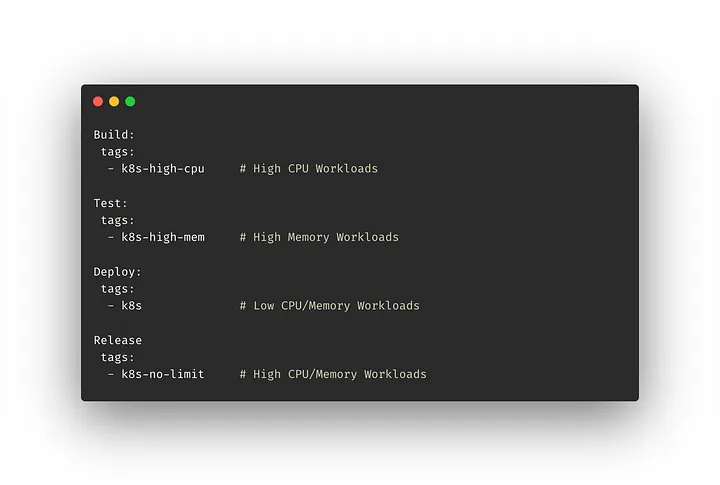 Targeting Kubernetes Executors in .gitlab.yaml
Our team experimented with different configurations for how we wanted to handle different resource needs, and ultimately decided this was the most optimal for our use cases, though you may find another approach that is better suited for your needs.
This provided a clear improvement over the Docker Executors with respect to managing capacity, though we were getting a lot of feedback related to degraded performance and reliability.
More specifically, the feedback was generally related to one of the following…
Pending Job Duration — Teams were noticing an increased amount of time waiting for a job or pipeline to begin due to it being in a pending state. This was typically the result of waiting for additional nodes to be provisioned.
 SLO Measuring Daily Pending Job Duration Total (~6-10 hours)
Intermittent Failures — Teams were noticing an increased number of CI jobs that were failing intermittently for several reasons, most notably due to CPU throttling or pod eviction.
After further investigation and collecting additional metrics on our CI jobs, we had a much better understanding of why we were seeing degraded performance and reliability.
Most importantly, there was a realization that CI jobs have the following distinct characteristics that makes it challenging when leveraging Kubernetes Executors (and the Kubernetes Cluster Autoscaler):
Rapid Spikes — It is common to see frequent larger spikes in job volume that are, for the most part, unpredictable in both quantity and duration.
Resource Diversity — CI jobs come in all shapes and sizes and the infinite combination of jobs and the CPU and Memory requirements is largely unpredictable as well.
We wanted a better solution, so we invested time into understanding more about the problem.
The Challenges
Kubernetes currently offers the following three autoscaling components:
- Cluster Autoscaler — Manages node pool size based on demands of workloads.
- Horizontal Pod Autoscaler — Manages the number of pods in response to CPU, Memory and/or custom metrics of workloads.
- Vertical Pod Autoscaler — Manages pod size based on resource requirements.
Since the GitLab Kubernetes Executors interact directly with the Kubernetes API to create a pod for each GitLab CI Job, our options were limited with respect to improvements using horizontal and vertical pod autoscaling. This dismissed solutions such as KEDA (Kubernetes Event Driven Autoscaling) as tenable solutions.
So we focused our attention on better understanding the behavior and capabilities of the Cluster Autoscaler to determine if we could improve performance.
The Cluster Autoscaler
By default, the Cluster Autoscaler works in the following way:
- Executes on a per-node-pool basis
- Makes scaling decisions based on the resource requests rather than actual resource utilization
- Adds nodes if pods are unschedulable due to lack of nodes in the node pool
- Removes nodes if they are underutilized and all pods could be scheduled with fewer nodes in the node pool
While this behavior makes sense for a large majority of use cases, it was not ideal for ours and the distinct behavior we were seeing with CI jobs.
In addition, solutions such as over-provisioning and graceful node termination which would allow us to reconfigure this behavior to improve performance were either not available or not viable for our use case.
For more details on the Cluster Autoscaler, take a look at the Cluster Autoscaler FAQ . It ended up being a great resource to develop an understanding of the internals of how it works and what can be configured.
The Solution
We spent a good amount of time researching custom autoscaling to gain a better understanding of why it wasn’t very common (and often discouraged).
The answer turns out to be quite simple and makes perfect sense.
By default, the Cluster Autoscaler is highly optimized for efficiency in resource utilization rather than performance.
A good explanation reflecting this sentiment can be found in the FAQ in response to the question How is Cluster Autoscaler different from CPU-usage-based node autoscalers?
Cluster Autoscaler makes sure that all pods in the cluster have a place to run, no matter if there is any CPU load or not. Moreover, it tries to ensure that there are no unneeded nodes in the cluster.
CPU-usage-based (or any metric-based) cluster/node group autoscalers don’t care about pods when scaling up and down. As a result, they may add a node that will not have any pods, or remove a node that has some system-critical pods on it, like kube-dns. Usage of these autoscalers with Kubernetes is discouraged.
However, we wanted a better solution and felt that performance could be improved by adjusting how autoscaling behaved to better match our use case.
Design Goals
With a strong understanding of our use case and the current limitations, we set out to implement custom autoscaling behavior for our GitLab CI Jobs with the following design goals in mind:
Rapid Scaling, Graceful Teardown — Optimize scaling behavior to be resilient to large spikes (and falls).
Utilization Based API — Provide a familiar, utilization based API, similar to Horizontal Pod Autoscaling, to take advantage of percentage-based utilization targets that will be independent of factors such as node size and quantity.
Extensibility — Allow additional metric sources to leverage more advanced scaling strategies (e.g. predictive scheduling based on historical data).
Custom Scaling
Inspired by the design of KEDA, our team recently operationalized the first iteration of our custom autoscaling solution using the operator pattern and Custom Resource Definitions (CRDs) to manage autoscaling behavior for our Gitlab CI Jobs, or more specifically the nodes they are running on.
Let’s look closer at these two CRDs:
UtilizationMetric — Determines node pool size based on configured target utilization.
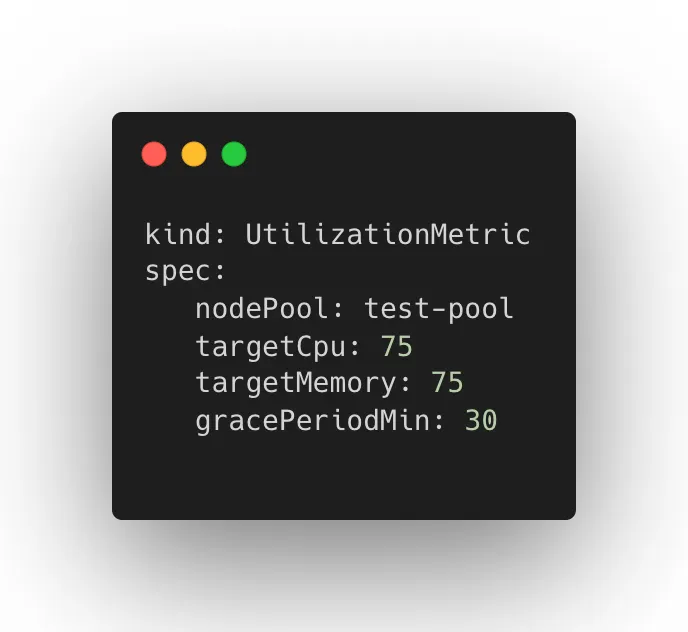 UtilizationMetric CRD
NodePoolMonitor — Determines autoscale configuration that will be applied to a specified node pool.
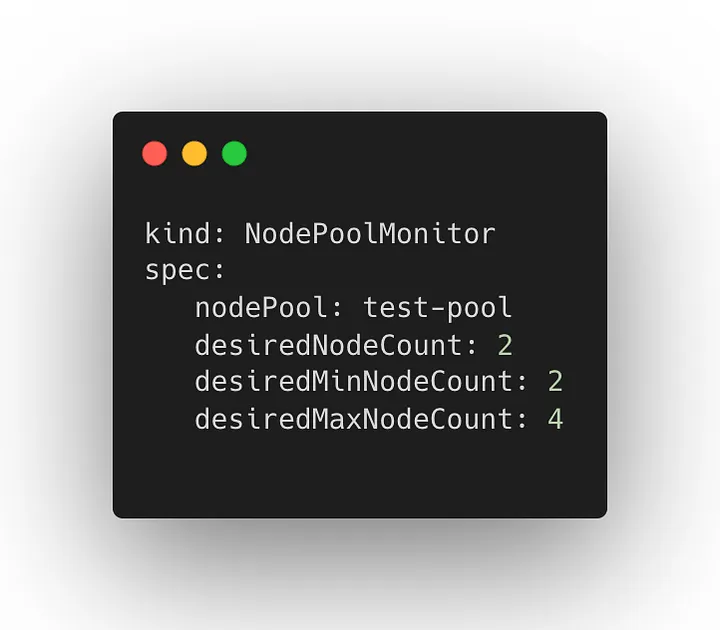 NodePoolMonitor CRD
Collectively, these two resources and their corresponding operators work together to provide a utilization driven approach to autoscaling optimized for rapid scaling and graceful teardown giving us more control over the node pool used by our GitLab CI jobs (and potentially other workloads in the future).
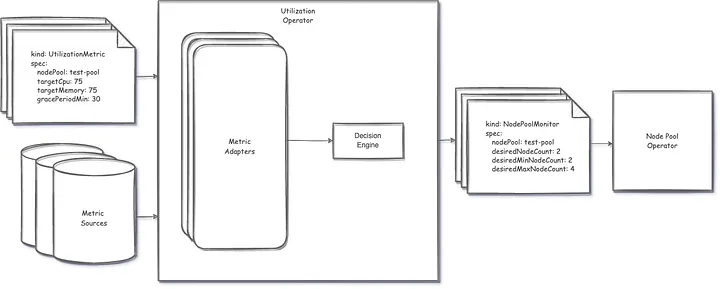 High Level Architecture
The Results
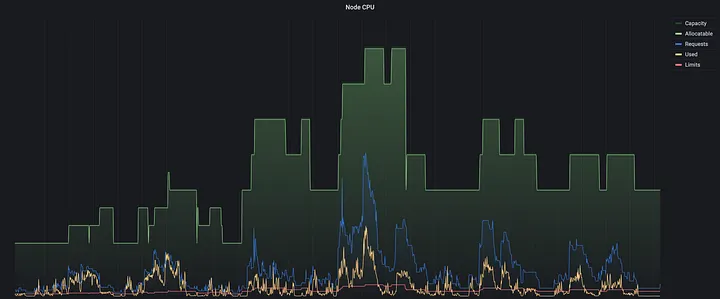 Utilization Based Autoscaling in Production
This shift to a utilization-based approach has allowed our autoscaling to be more resilient to the behavior of the workloads we are running and given us more flexibility in managing resource requirements.
We have observed up to a 95% reduction in our Pending Job Duration SLO and are working toward more accurately measuring reduction in intermittent errors due to CPU throttling and pod eviction (though some other factors have admittedly also helped us improve this as well).
 Improved Daily Pending Job Duration SLO (10-60 minutes)
While we intend to keep iterating to further improve performance and cost effectiveness, we are very satisfied with the results and improvements we have seen thus far.
What’s Next?
We took an iterative approach to building custom autoscaling, and will continue to take a data-informed mindset to further identify opportunities for improvements.
Some potential next steps we have considered:
Performance and Cost Improvements — We will continue to identify opportunities to improve performance when scaling as well as identify strategies to improve cost effectiveness.
Additional Metric Adapters — While it is not an immediate need for our current use case, supporting alternative metric adapters such as Prometheus would allow us to utilize predictive scaling strategies for more seasonal workloads.
Open Source — Discussions around open sourcing our solution had come up early and we will continue to discuss this moving forward.
Summary
Improving the Delivery Value Stream at Quantum Metric is an ongoing effort as we continue to grow. While we didn’t initially set out to implement custom autoscaling, we took advantage of the opportunity to experiment with a better solution and are happy with the results we have seen.
Have you ran into similar issues and solved them similarly or even completely different? Either way, we would love to hear more about it!